
Generation
How we model generation capacity and output in ERCOT.
ERCOT generation
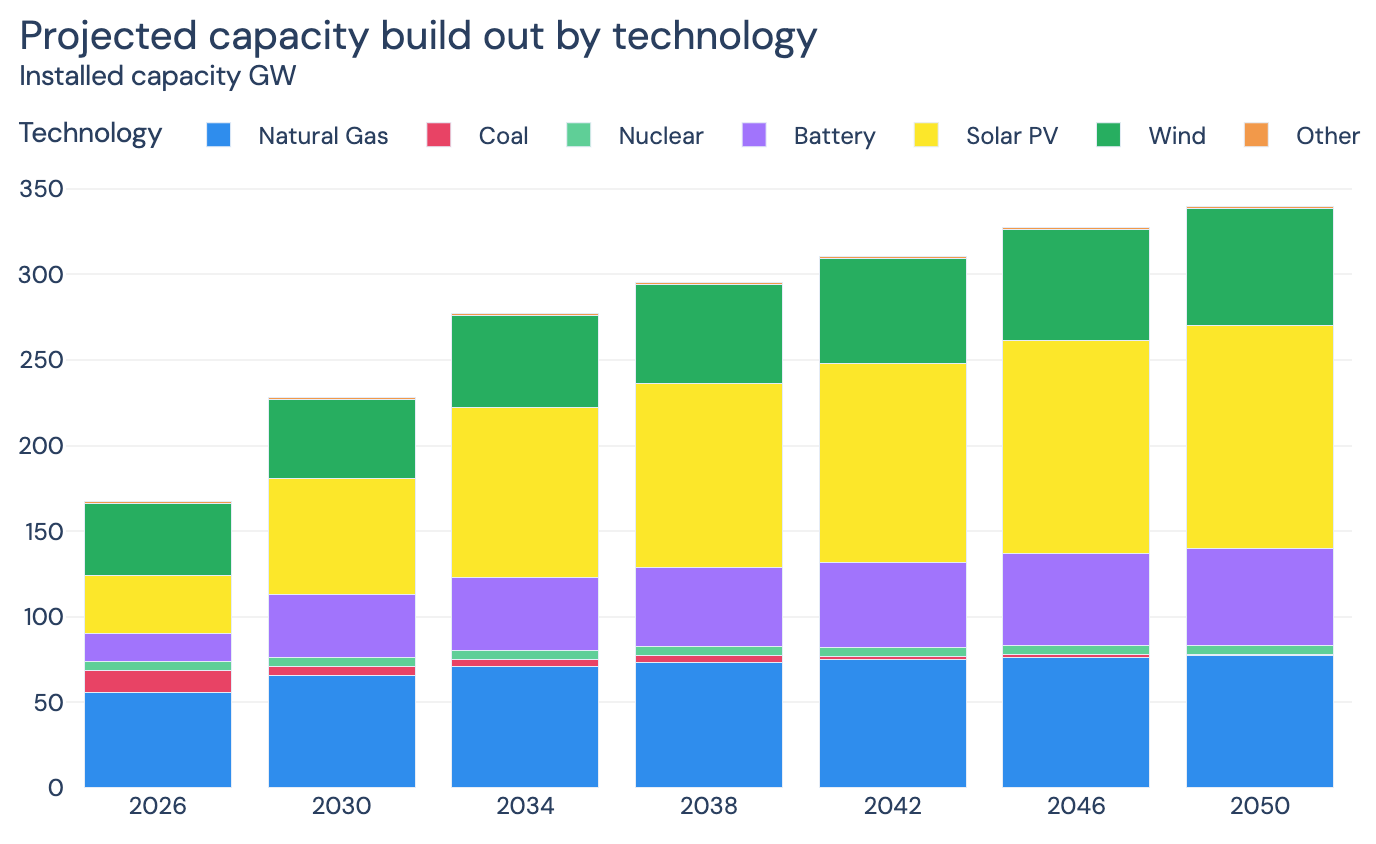
Capacity buildout
Description
Up until 2031, capacity additions are informed by ERCOT’s Generator Interconnection Status (GIS) queue. Projects are evaluated based on their development status, such as the posting of financial security or completion of interconnection studies. Only those that have achieved key milestones are assumed to reach commercial operation, with estimated timelines adjusted accordingly to reflect realistic delays.
Beyond 2031, the model adopts a stylized buildout approach designed to maintain system adequacy and avoid implausible outcomes. While this is not based on a formal economic optimization, it is loosely guided by directional trends found in external projections, notably the EIA’s Annual Energy Outlook “High Renewables” scenario.
Plant retirements are incorporated based on publicly announced shutdowns where available. In the absence of such announcements, retirements are projected using technology-specific lifespan assumptions, drawing from the EIA Generator Inventory dataset.
Central case
Policy drivers
- All units backed by the Texas Energy Fund are added to the generation stack with commercial operation dates between now and 2030.
- Additional generation is introduced to support industrial load growth in West Texas - particularly in the Permian Basin to support the projected load growth of oil & gas. This additional generation is in line with the approach taken by ERCOT in their Regional Transmission Plan studies and Permian Basin Reliability Plan study.
Assumptions and caveats
- Build decisions are made exogenously to the model and are not determined by a capacity expansion algorithm.
Data sources
| Source | Description | Link |
|---|---|---|
| ERCOT Generator Interconnection Status (GIS) queue | Informs short-term buildout assumptions based on project development milestones | ERCOT GIS Reports |
| EIA Generator Inventory | Asset-level data on generation technology, operational status, and age; used for retirement assumptions | EIA Generator Inventory |
| EIA Annual Energy Outlook (AEO) | Directional guide for long-term capacity growth, referencing the High Renewables scenario | AEO Scenarios |
| ERCOT Regional Transmission Plan (RTP) studies | Supports modeling of load-driven buildout, particularly in the Permian Basin | ERCOT RTP |
Short-run marginal costs
Description
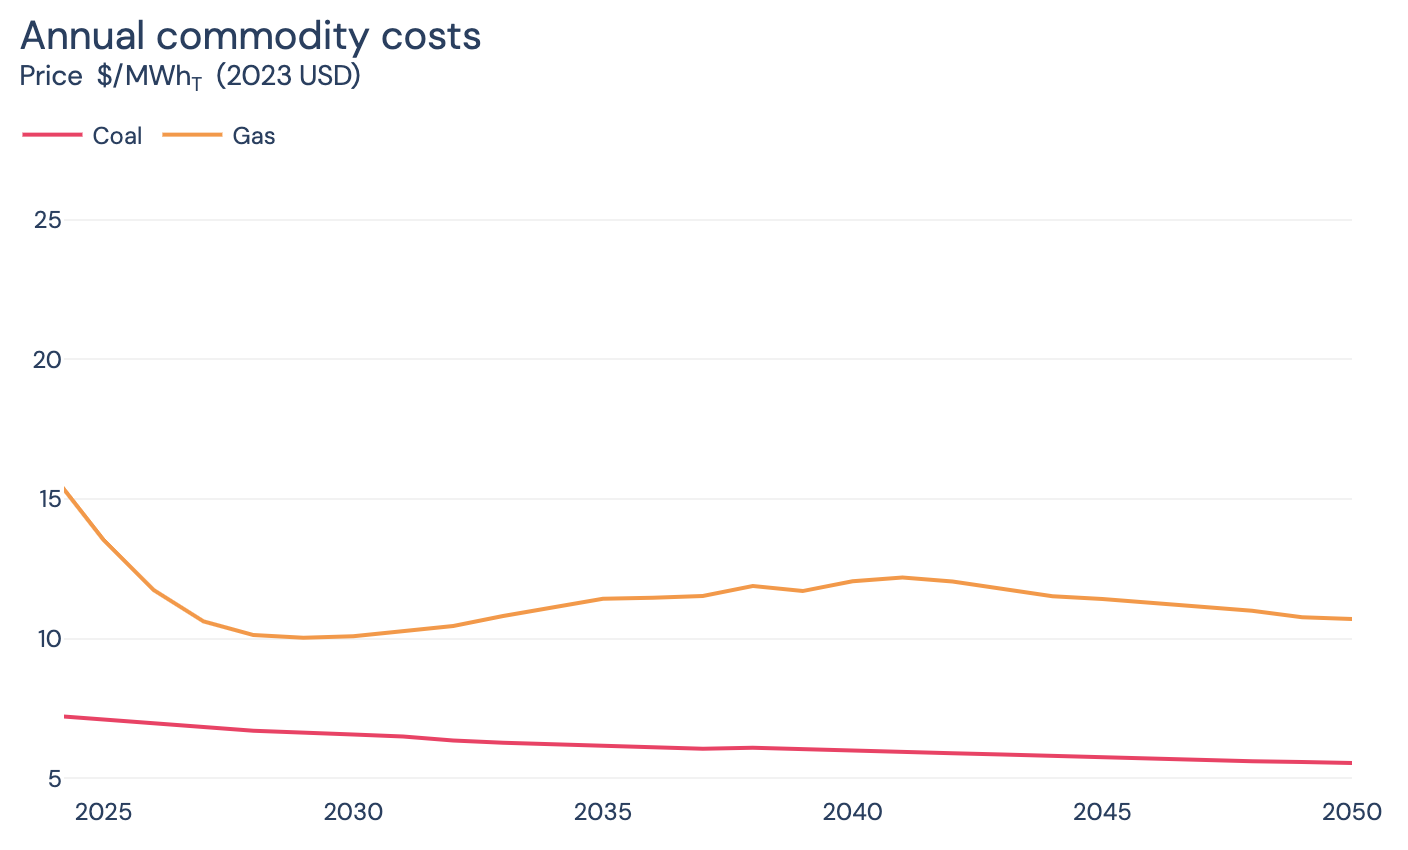
Short-run marginal costs (SRMCs) are estimated for all generation technologies in the system, including thermal and renewable assets. These values are derived primarily from fuel prices and heat rate assumptions. Fuel prices are sourced from the EIA’s Annual Energy Outlook commodity input data for coal and natural gas.
Where available, historical operating data is used to capture time-varying heat rates, allowing for seasonal differences and more realistic dispatch behavior. Specifically, we use ERCOT’s 60-day SCED disclosure data to estimate historical generator performance and derive implied unit-level heat rates. For new or prospective resources without operational data, technology-average heat rates are used (again derived from SCED data).
For variable renewable technologies such as wind and solar, SRMCs are adjusted to reflect tax credits, which can result in negative marginal costs.
Additionally, stepped bid curves are incorporated to reflect price markups under system scarcity conditions.
The table below summarizes:
| Technology | Fuel Type | Average Heat Rate (MMBtu/MWh) | Scarcity Bid Heat Rate (MMBtu/MWh) | Tax Credit Effect ($/MWh) |
|---|---|---|---|---|
| Combined-cycle gas | Gas | 6.0 | 8.8 | — |
| Single-cycle gas (CT) | Gas | 9.7 | 12.4 | — |
| Reciprocating engines | Gas | 9.5 | 12.5 | — |
| Coal/lignite | Coal | 8.3 | 11.3 | — |
| Solar PV | — | — | — | -15.0 |
| Wind | — | — | — | -15.0 |
Central case
The commodity prices used in our central case are derived from EIA's Annual Energy Outlook
Policy drivers
- Production tax credits (PTC) and investment tax credits (ITC) for wind and solar are reflected in SRMCs. These credits phase out for projects coming online after 2032.
Assumptions and caveats
- No modeling of gas basis differentials across the ERCOT footprint.
- Technology-average heat rates are used for future or unbuilt units.
Data sources
| Source | Description | Link |
|---|---|---|
| EIA Annual Energy Outlook (AEO) | Provides long-term commodity price trajectories for fuels | EIA AEO Data |
| ERCOT 60-day SCED disclosure data | Used to estimate time-varying, unit-specific heat rates from historical generator dispatch | ERCOT Market Data Portal |
| PTC/ITC guidelines | Informs tax credit adjustments to renewable SRMCs | IRS Energy Credits |
Start costs
Description
Startup costs are modeled for thermal technologies that require discrete commitment decisions. Nuclear, solar, wind, and storage are assumed to be continuously available and do not incur startup costs in the model.
Start cost values are derived from historical market data, imputed using forecast commodity prices to estimate time-varying startup costs. These values are expressed as a fixed cost in $/MW per start and are applied only in the unit commitment step of the model to influence plant scheduling decisions.
Central case
Assumptions and caveats
- Startup costs are only applied to technologies that require explicit unit commitment.
- No modeling of hot vs. cold start cost differences.
- Startup costs are excluded from economic dispatch; they influence commitment only.
Data sources
| Source | Description | Link |
|---|---|---|
| Historical startup cost data | Used to estimate $/MW/start values by tech, adjusted using forecast fuel prices | ERCOT Market Data |
| Fuel price forecasts (EIA AEO) | Inform variation in startup costs over time | EIA AEO Data |
Renewable load factors and outages
Description
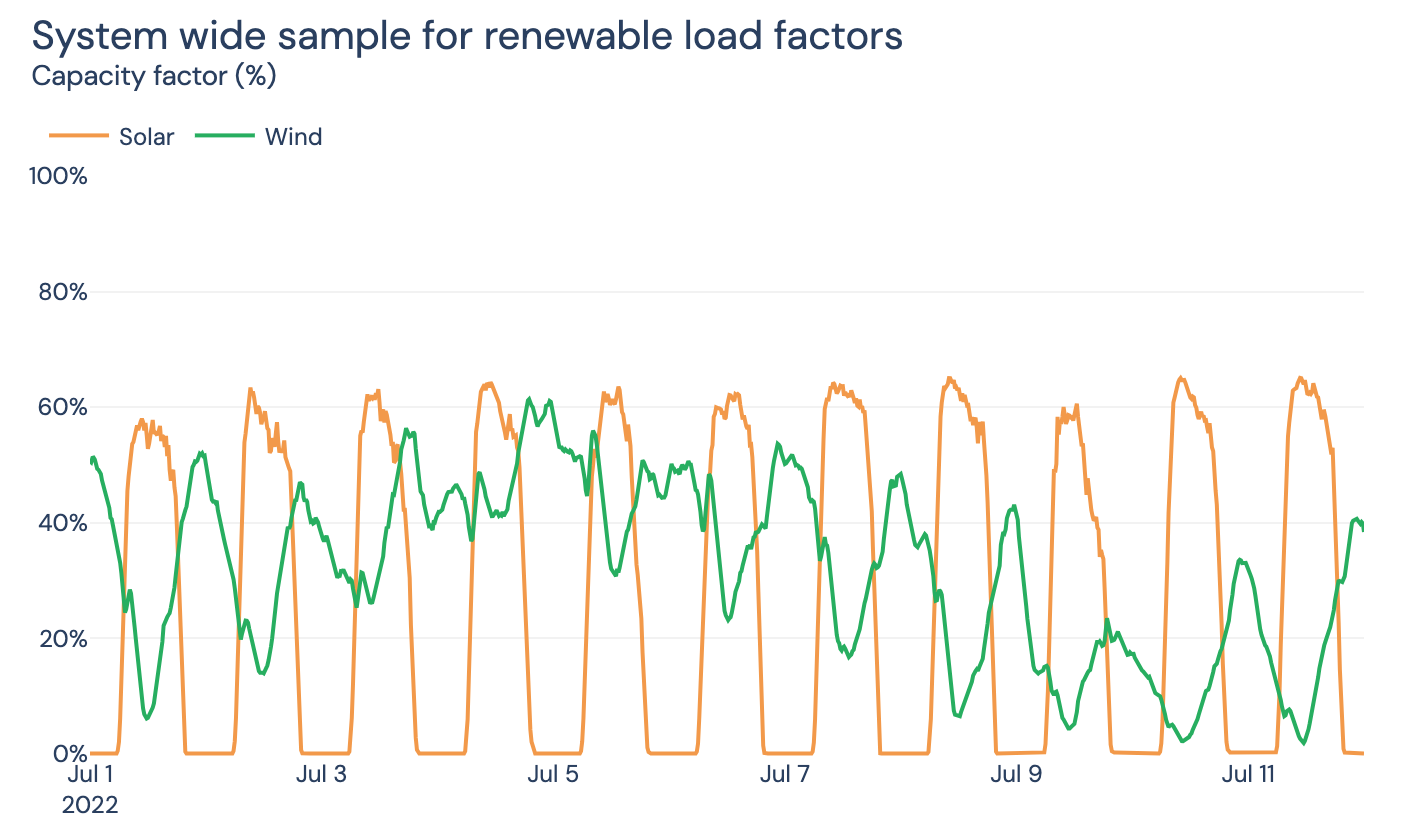
Both load factors and outages profiles are modeled similarly and use historical available capacity data from ERCOT’s SCED disclosures; specifically, the High Sustained Limit (HSL) of individual units. Each generator’s HSL is expressed as a percentage of its nameplate capacity (sourced from the MORA dataset) to calculate an empirical load factor.
For existing wind and solar generators, this observed load factor is held constant throughout the forecast horizon. New build generators are assigned load factors based on the regional (zonal) average for the same technology class, reflecting geographic diversity and typical resource performance in that area.
Outages are modeled using the same HSL-derived method; reductions in available capacity reflecting planned or unplanned outages—are captured in the empirical load factor calculation.
Central case
Assumptions and caveats
- Load factors and outages rates are based on a "weather year", which is 2022, and do not evolve over time.
- New builds inherit regional average load factors for their technology class.
- Outages are captured via reduced HSL values, without explicit modeling of whether an outage is planned or unplanned.
- No adjustment is made to load factors or outages over time to reflect technology improvements or generator wear and tear.
Data sources
| Source | Description | Link |
|---|---|---|
| ERCOT 60-day SCED disclosure data | Provides High Sustained Limits (HSL) for calculating load factors and outages | ERCOT Market Data |
| ERCOT MORA dataset | Used to match generators to nameplate capacities | ERCOT MORA |
Updated about 1 month ago