
Backtest
How we make sure we can stand behind our numbers
Production Cost Model
A core aspect of Modo’s data science team involves ensuring that the mathematical modeling and underlying assumptions of our models are firmly grounded in market fundamentals and produce realistic outcomes. To validate this, the models are backtested against historical data, assessing their accuracy in capturing market prices and asset dispatch behaviors.
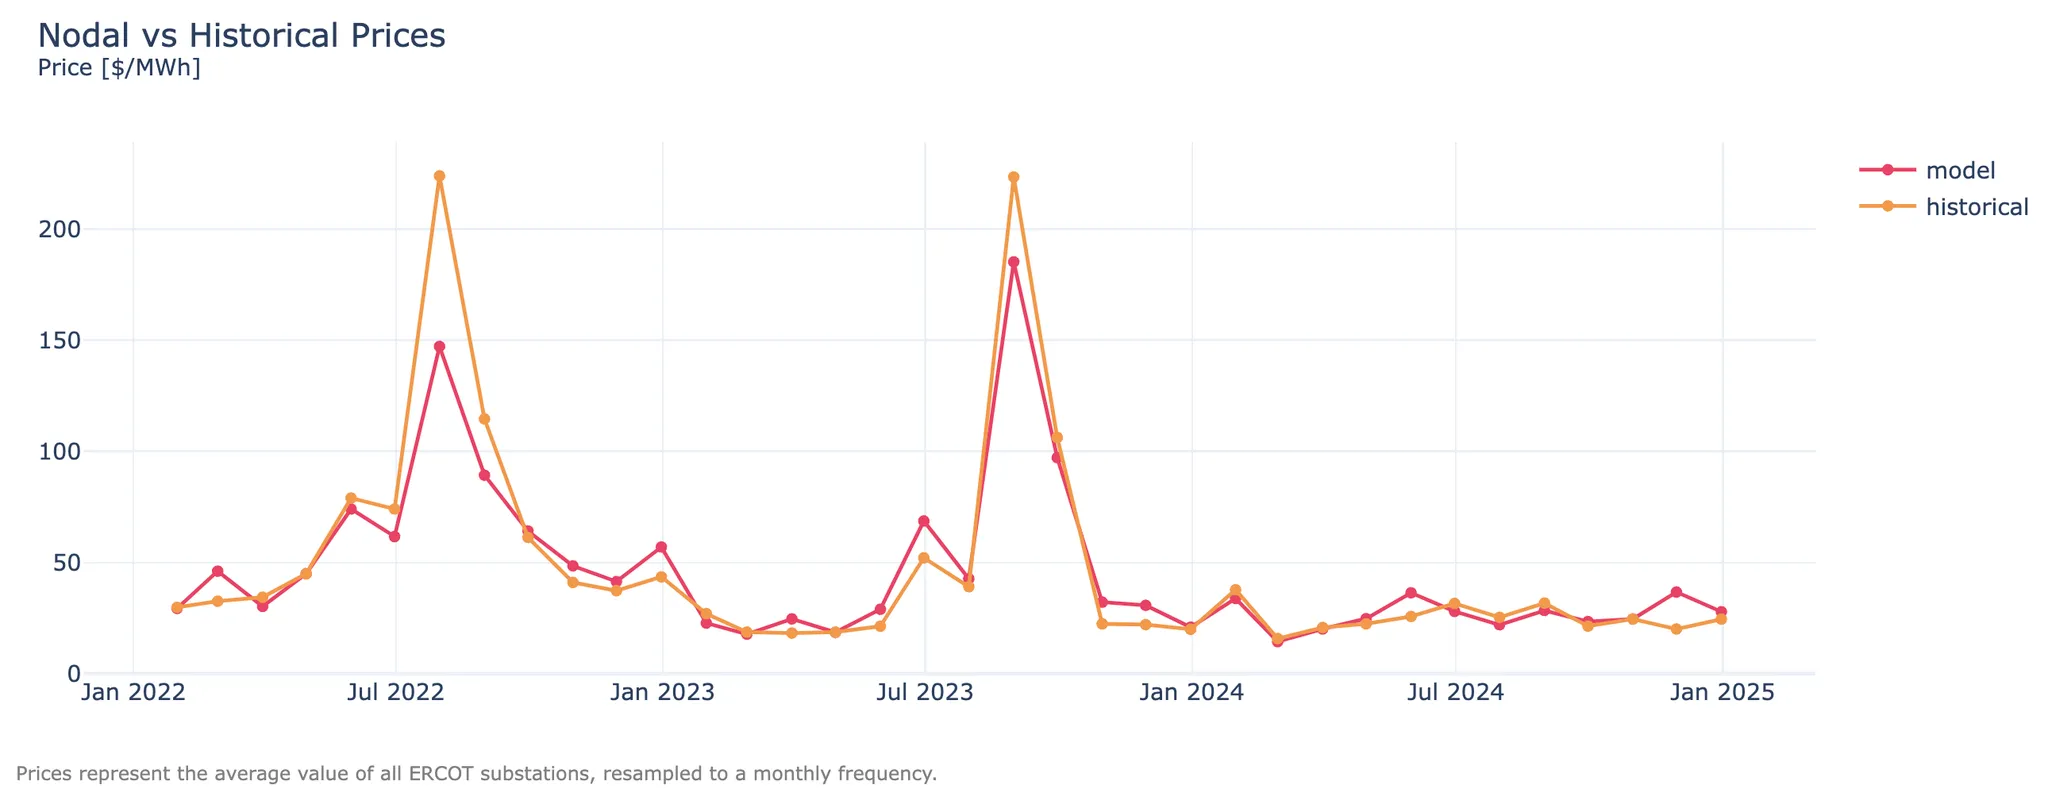
The graph below demonstrates how our modeled prices compared to historicals on a monthly basis since 2022:
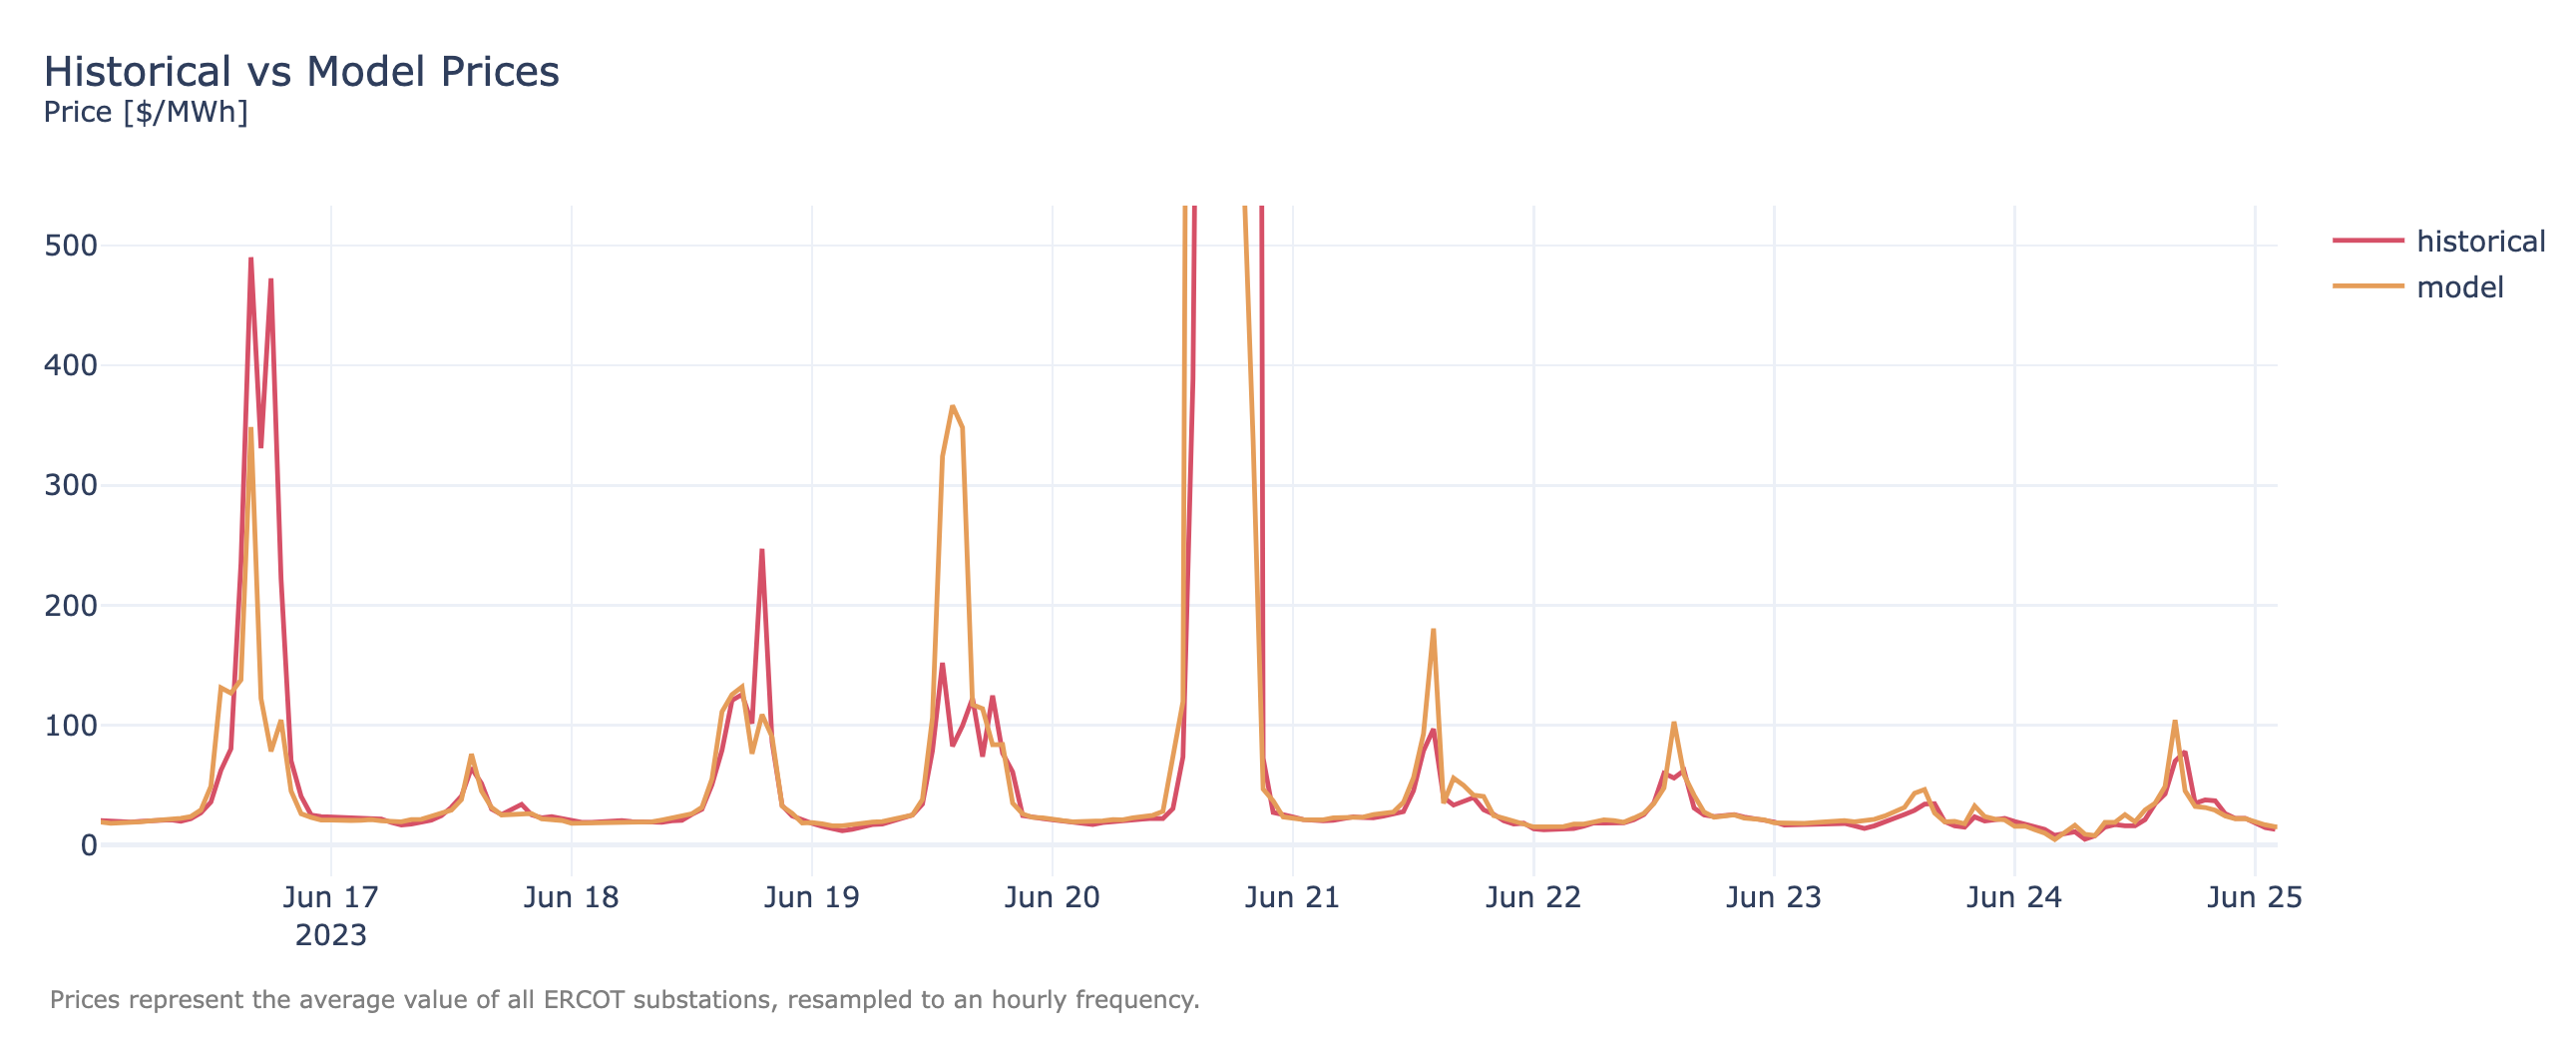
Zooming in on prices’ daily shape:
The model's prediction errors are evenly distributed around 0 with a mean error of -2.58 $/MWh:
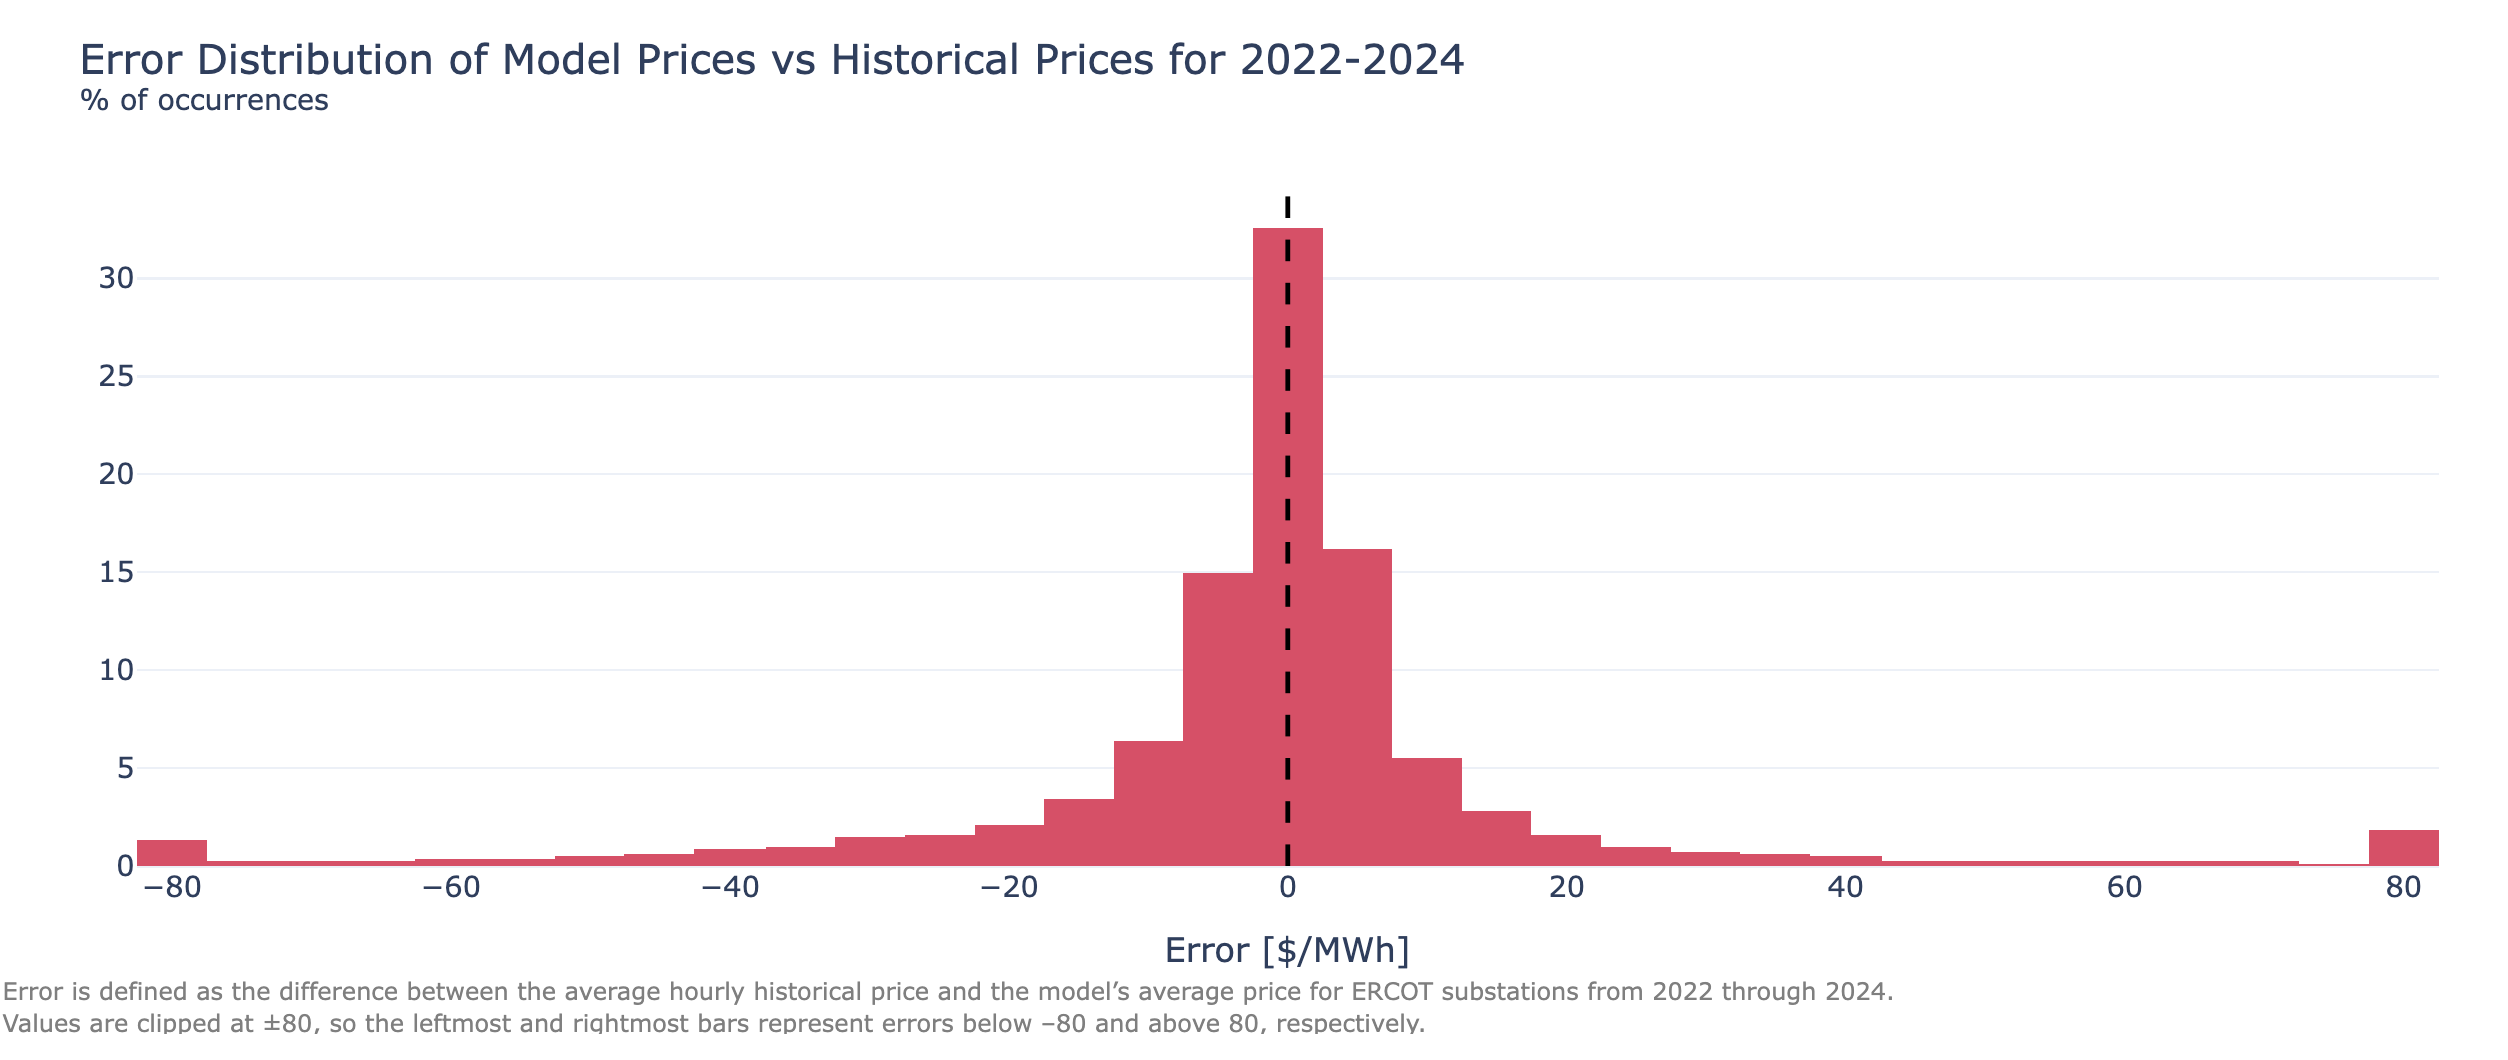
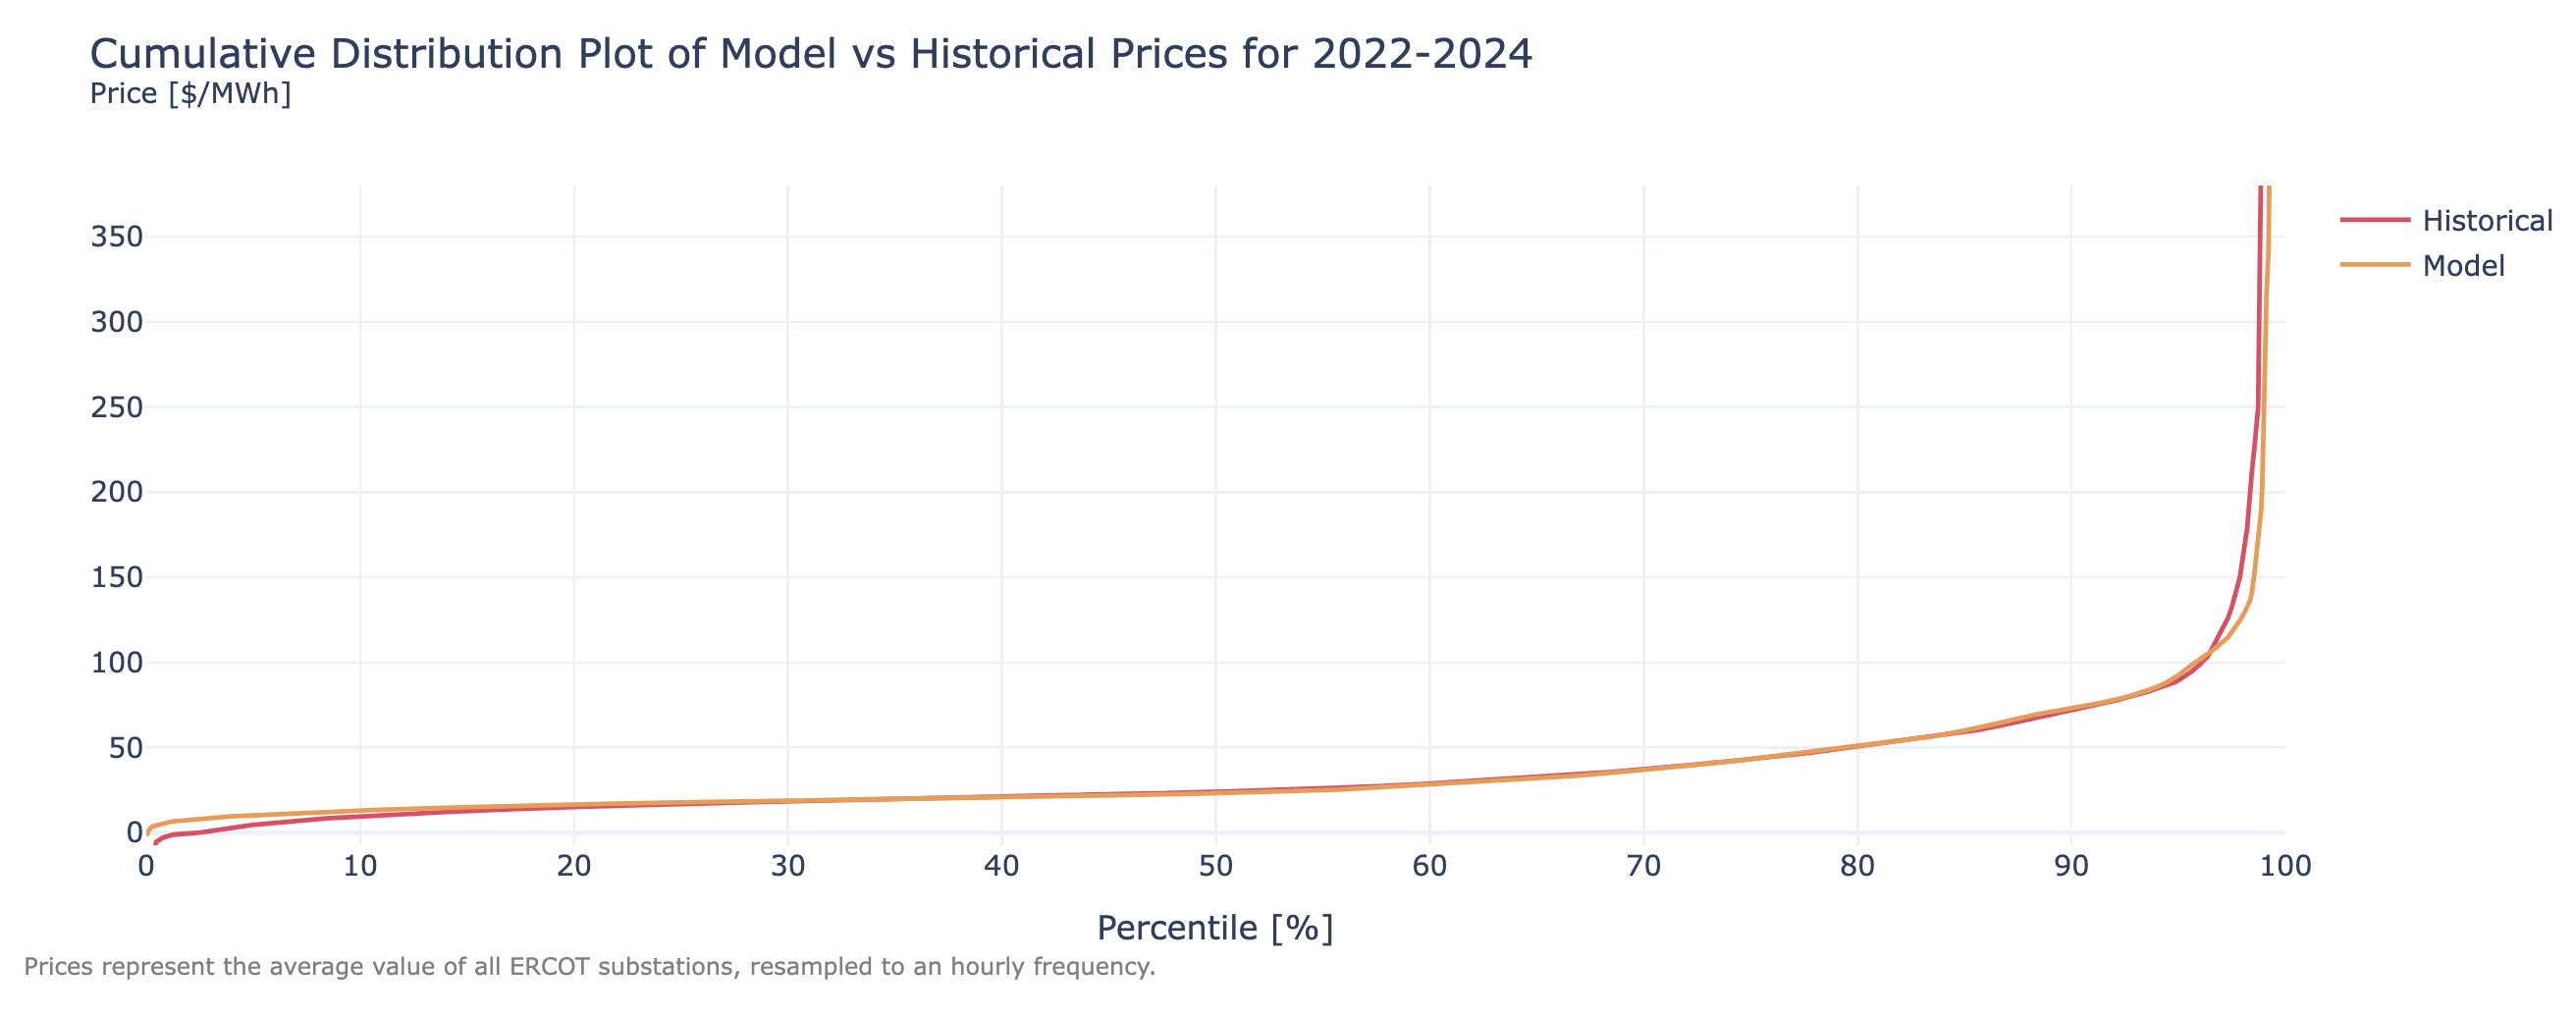
The model slightly underestimates the frequency of prices below 20$/MWh and overestimates those between 20-40$/MWh, while showing a good overall alignment with reality:
Dispatch Model
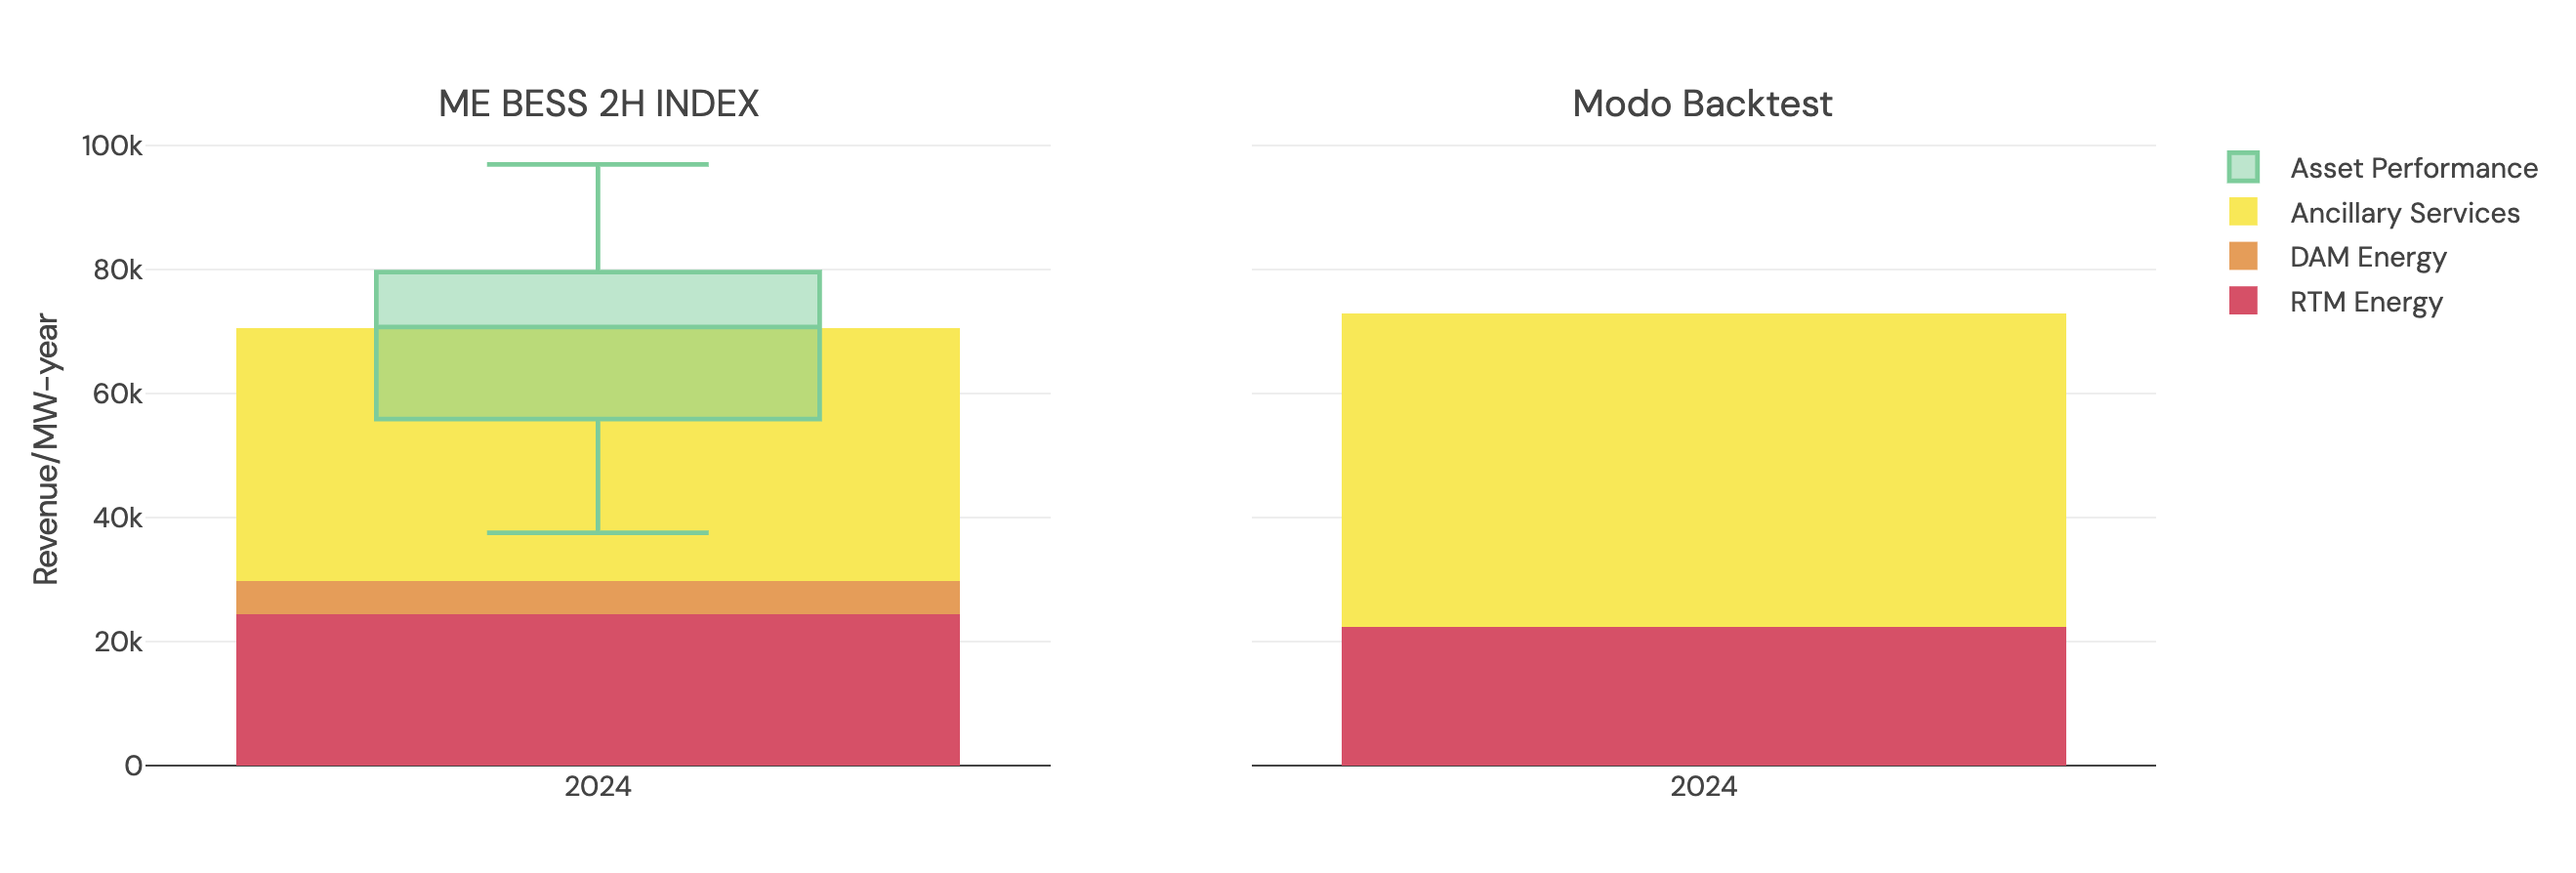
The energy and ancillary service prices are leveraged by the dispatch model to create realistic revenues for individual battery assets which are compared to Modo’s proprietary ME ERCOT BESS 2-hour index.
The following chart shows a 2-hour sample asset run for 2024 alongside the 2-hour index’s average revenue stack, with whiskers indicating the best- and worst-performing assets as well as the 75th and 25th percentiles:
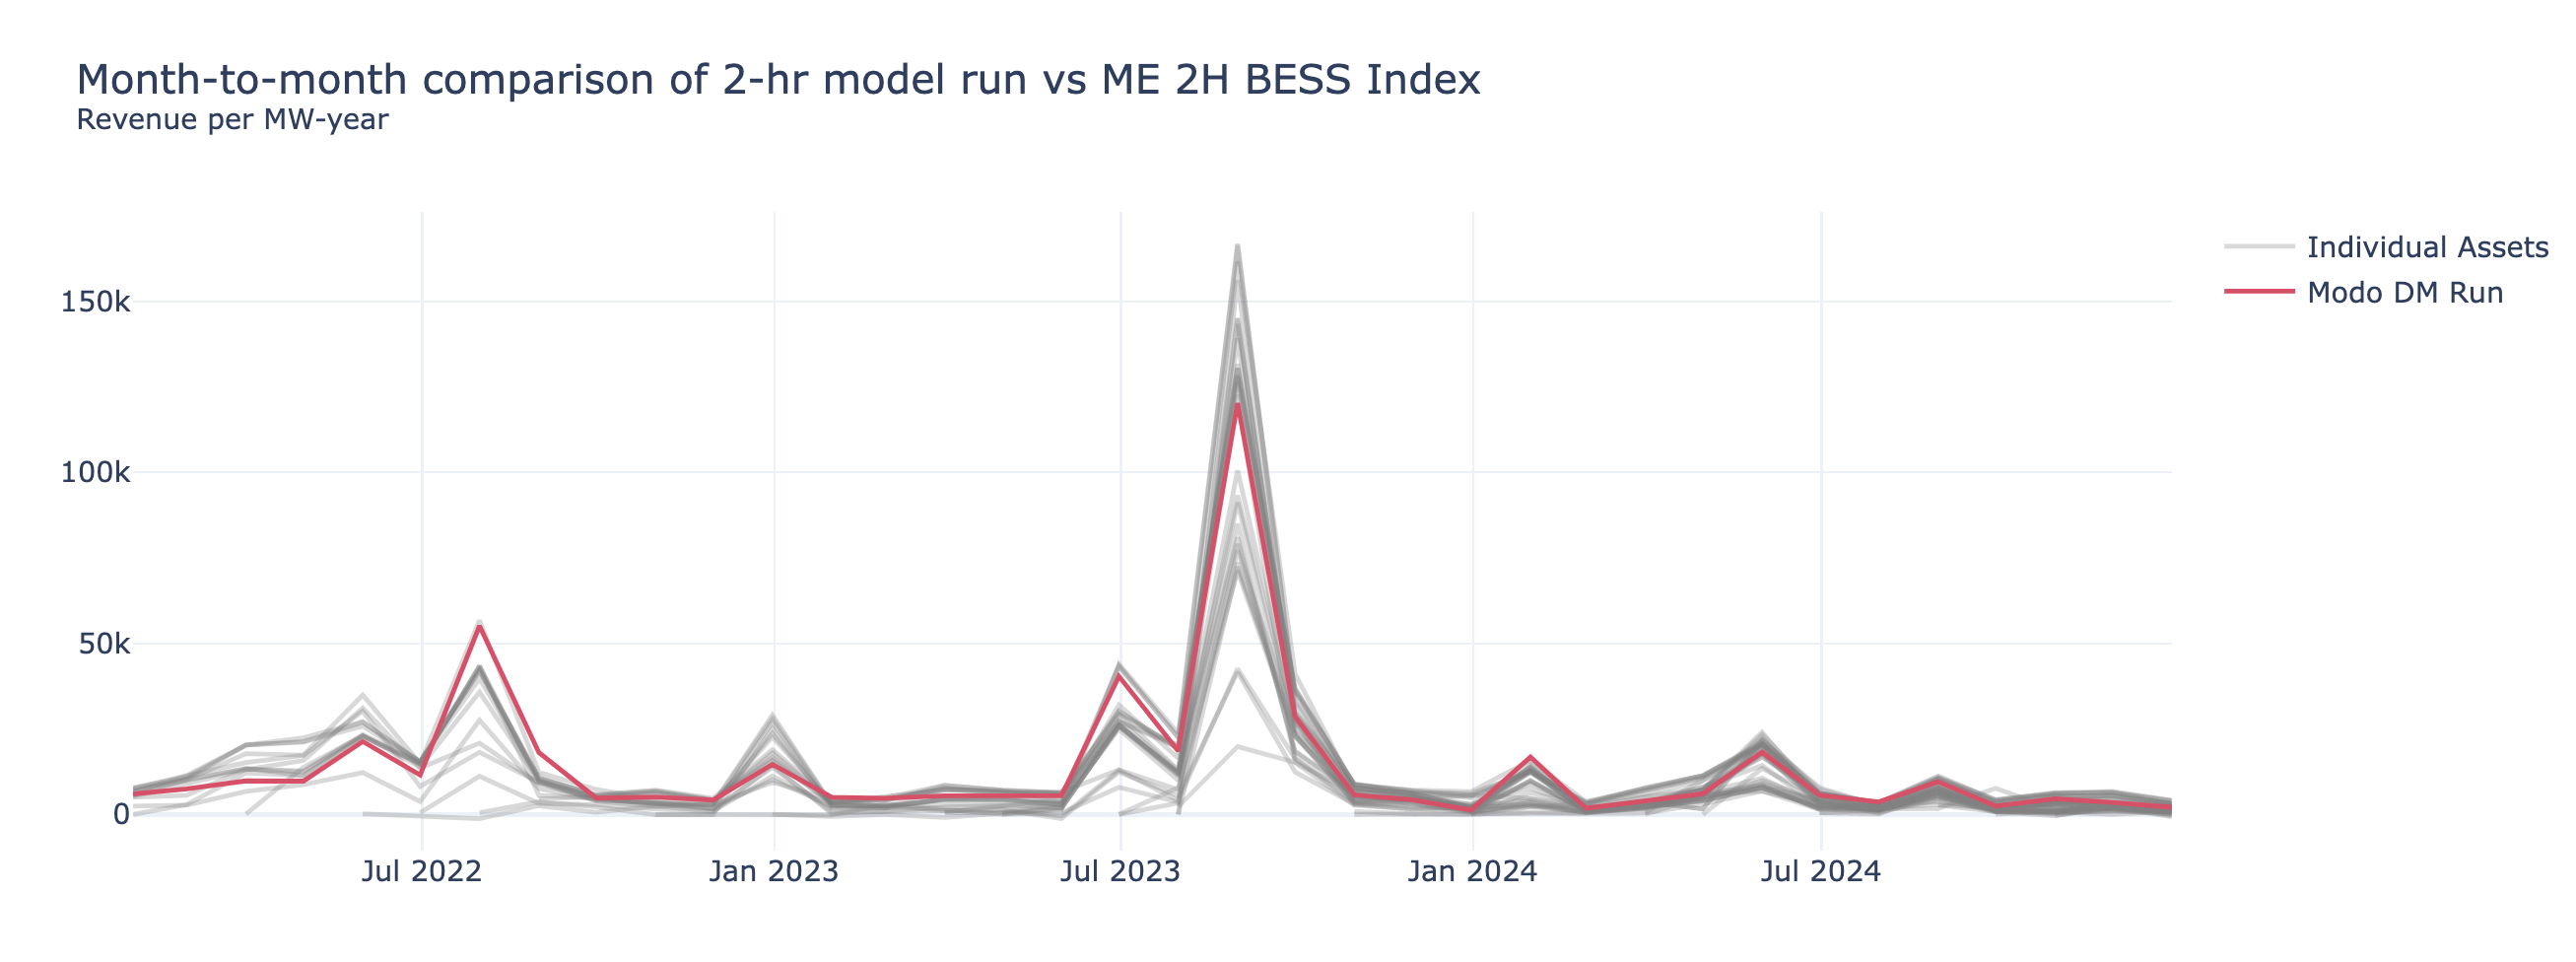
The model has been stress-tested during scarcity‐pricing periods in 2022 and 2023 and demonstrated revenue results that fall within the range of the ME index, as shown below:
Updated 19 days ago